Humans make hundreds of decisions daily, from what we eat for breakfast to how we style our hair or the most efficient way to drive to work. Typically, these decisions are based on preference, experience, or the information available to us at the time.
Unfortunately, applying this deeply personal decision-making formula to business solutions, relying solely on intuition or subjective judgment, may not yield optimal business outcomes.
While this type of decision-making can work with choosing where to go to dinner, business decision-makers can leave their business vulnerable if they make critical business decisions without the right data.
However, if we cannot rely on our gut instincts to make business decisions, where can we get the “right data” that is trustworthy and easy to manage and view?
Enter Microsoft Power BI.
Power BI is Microsoft’s free cloud-based platform that allows anyone to visualize and analyze data. With Power BI, you can set aside decision-making based on preference or experience and make decisions grounded in data and objective insights.
This article will examine some of the finer points of Power BI usage, such as:
Through these finer points of Power BI, you can learn how to use the software and how to transition your business decisions from gut feelings into data-driven decisions grounded in objective insights and empirical evidence.
History of Power BI
Businesses today are amassing tons of data, which isn’t very useful if you cannot make heads or tails of it. To provide a solution for companies to pull comprehensive insights from their data, Microsoft created Power BI.
Released as a standalone platform in July 2015, this free software connects data sources and provides users with a visually aesthetic report.
The program was built to connect other Microsoft Excel spreadsheets or bring together cloud-based and on-premises data warehouses. Data pulled from sources such as Salesforce CRM, Excel, or other data sources can be automatically refreshed.
With its user-friendly interface and analytics capabilities, understanding what Power BI is can empower users to look deeply at their data to:
- Discover correlations
- Gain actionable insights from complex data sets
- Perform advanced data analysis and calculations
- Conduct in-depth data exploration and visualization
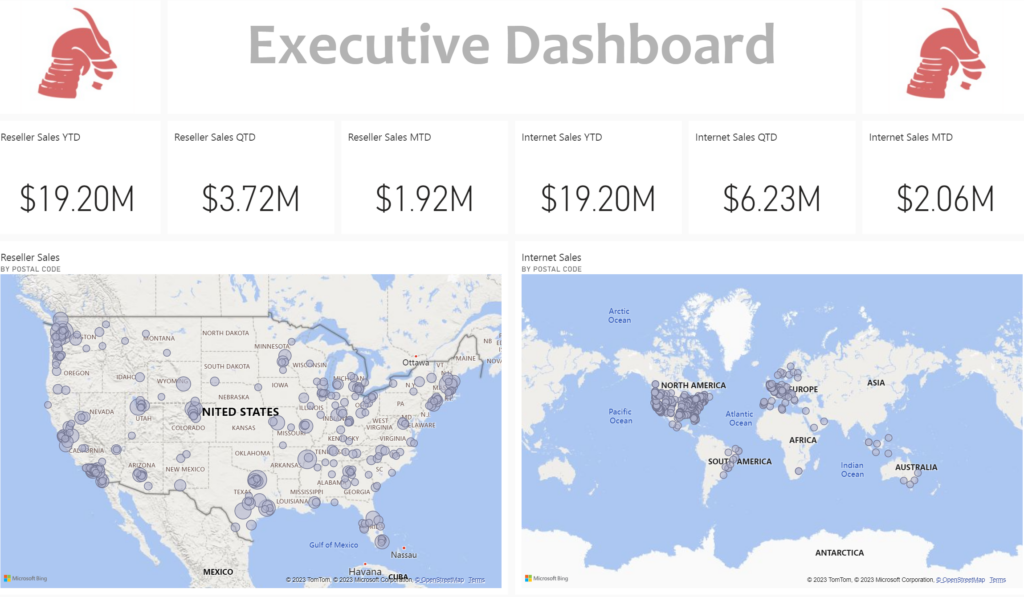
- Create interactive reports and dashboard
As a Power BI expert, you can use data to influence decision-making. When you can slice your data into visual data sets that make sense, you can increase the likelihood of achieving your desired outcomes, mitigate risks, and drive overall success in your professional endeavors.
Understanding Microsoft Power BI

Power BI sorts and aggregates your raw business data and transforms that data into visual and actionable intelligence. However, it offers more than a single output and usability. It has the flexibility to work in various capacities, and depending on how you want to build and view your data, Power BI has a solution. These solutions are:
- Power BI Desktop
- Power BI Service
- Power BI Report Builder
- Power BI Mobile
Power BI Desktop
This powerful desktop application allows users to create interactive data visualizations and reports. Within this area, you can view the data connectors you want to join to various data sources, such as databases, Excel files, or cloud services. The desktop interface is the place to manage data models, design interactive dashboards, and create advanced reports using the drag-and-drop interface.
Power BI Service
This arm of Power BI is the cloud-based component that allows you to publish, share, and collaborate on your Power BI reports and dashboards. After the reports are created within Power BI Desktop, they can be uploaded to Power BI Service, making them accessible to others in your organization. Using Power BI Service offers additional features such as:
- Automatic data refreshes
- Scheduled report deliveries
- The ability to create and share content packs
Power BI Report Builder
Power BI Report Builder is a standalone tool that allows you to create paginated reports for Power BI. These reports are like traditional SQL Server Reporting Services (SSRS) reports and are designed for printing or exporting. Power BI Report Builder is useful for scenarios requiring pixel-perfect formatting and precise control over the report layout.
Power BI Mobile
Power BI Mobile lets you access your Power BI reports and dashboards using your mobile devices. You can view your reports on the go as it provides a responsive and interactive experience, allowing you to view, interact with, and explore your Power BI data from anywhere.
What Is Power BI And Will You Benefit From Using It?
The advantages of Power BI’s extensive visualization options and robust platform make it a valuable tool for diverse use cases. Below are some benefits that Power BI can bring to your organization if you plan on implementing it into your data reporting process.
Data Visualization: Power BI offers a range of visualizations you can mix and match to view your data. This can include graphs, charts, tables, and more. These data sets can be customized to suit reporting needs, enhancing data comprehension and enabling compelling storytelling.
Data Exploration and Analysis: Power BI empowers users to explore data from different angles, identify trends, and uncover hidden patterns. With features like data slicing, filtering, and drill-down capabilities, users can dive deeper into their data to extract meaningful information.
Report Creation and Publishing: Power BI enables users to create visually stunning reports and custom dashboards by combining multiple data sources, applying transformations, and adding calculated measures. These reports can then be published to the Power BI Service, which can be shared with stakeholders and accessed in real-time.
Collaboration and Sharing: Power BI allows users to collaborate seamlessly by sharing reports and dashboards with colleagues and stakeholders. With its robust security and access control features, organizations can ensure that the right people can access the right information while maintaining data privacy.
Real-time Monitoring: Power BI supports real-time data streaming and integration with various data sources, allowing users to monitor key metrics and KPIs in real-time. This feature is particularly useful if your organization requires up-to-the-minute decision-making insights.
Enhanced Data Insights: Power BI empowers users to transform raw data into actionable insights through intuitive and interactive visualizations. Power BI presents visually compelling information, enabling users to understand their data better and make data-driven decisions.
Increased Efficiency: With Power BI, organizations can automate data retrieval, transformation, and report generation processes, saving significant time and effort. The self-service capabilities of Power BI allow business users to create and modify reports independently, reducing their reliance on IT departments.
Improved Collaboration: Power BI’s collaborative features facilitate effective teamwork by allowing users to share reports, exchange insights, and provide real-time feedback. Stakeholders and project members can collaborate on the same up-to-date information, increasing transparency and communication.
Accessibility and Mobility: Power BI’s cloud-based service and mobile applications enable users to access reports and dashboards from anywhere, on any device. This flexibility ensures that decision-makers can stay informed and make data-driven choices even when away from their desks.
Scalability and Integration: Power BI integrates seamlessly with other Microsoft products and services, such as Azure, Excel, and SharePoint, providing a comprehensive analytics ecosystem. It can handle large volumes of data and scale per organizational needs, making it suitable for businesses of all sizes.
Invest in Power BI Today
Today, thousands of companies use Microsoft Power BI for their data, and those numbers continue to climb. Business intelligence is big business, and established companies are looking to Microsoft Power BI to make sense of their data to help them make educated decisions about the picture their data presents.
While Power BI starts as a free platform, it often takes a Power BI expert to make your data shine. At Rōnin Consulting, our Power BI experts and business intelligence professionals can make sense of your data and put the power of decision-making back into your hands based on data instead of on a gut feeling.
Trust a Rōnin to make sense of your data, and contact us today and obtain answers if you still have more “what is Power BI” questions.


